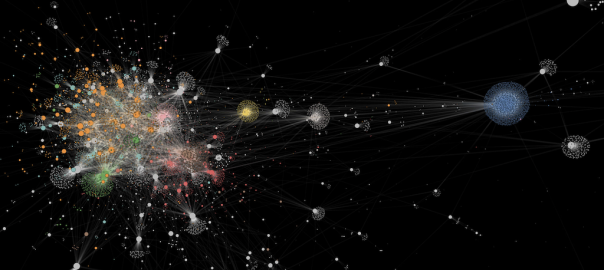
Today the Observatory on Social Media and CNetS launched a revamped research tool to give journalists, other researchers, and the public a broad view of what's happening on social media. The tool helps overcome some of the biggest challenges of interpreting information flow online, which is often difficult to understand because it's so fast-paced and experienced from the perspective of an individual account's newsfeed.
"You often hear something is going viral, but how?" said Filippo Menczer, director of OSoMe and Luddy Distinguished Professor of Computer Science and Informatics in the IU Luddy School of Informatics, Computing, and Engineering. "Our tools show you what the conversation is, who the players are, what the viral messages are, and you can even visualize polarization. It provides a place to explore topics and how they work together."
The Networks Tool, which has recently been updated, creates an interactive map (now in 3D) to explore how information spreads across Twitter. Users can visualize who is retweeting or mentioning whom on a particular topic, or which hashtags are being used with other hashtags, and all data can now be exported. Using the tool, researchers, educators, journalists, and the general public can see, at a glance, the complex networks that drive our online experience.
OSoMe's tools leverage a huge stream of data -- roughly 50 million tweets a day -- collected from Twitter. It equates to roughly 10 percent of public tweets, which are then analyzed and indexed for use through these tools. Users can visualize data from any given month from the previous three years. Most tools don't allow users to go back as far, Menczer said. "There's always a lot of debate about what's going on online," he said. "These tools are meant to help the public study these things and see for themselves."
Sarah Beverton led the development of the Networks tools. The tool uses the helios-web library developed by IUNI research scientist Filipi Nascimento Silva.